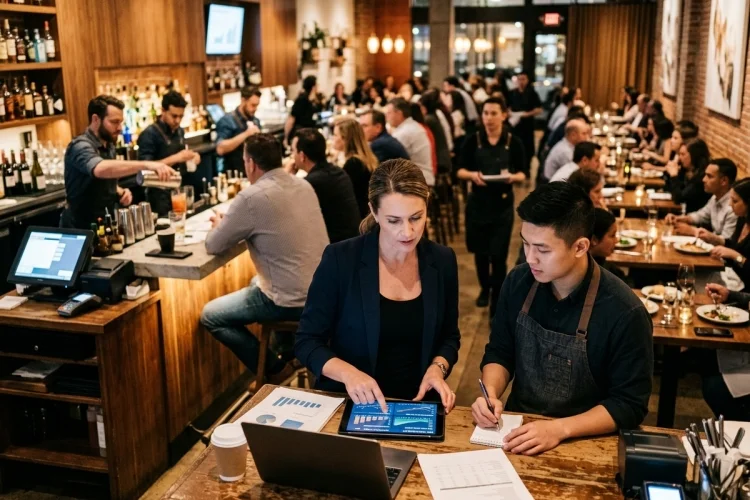
Running a busy restaurant can be misleading. A dining room may be packed, the bar may be three-deep, and the POS may show impressive daily sales, yet the venue can still produce disappointing profit.
High volume magnifies both good decisions and small inefficiencies. That is why Advanced Restaurant Unit Economics goes deeper than basic food-cost percentages or monthly revenue.
It connects every cover, labor hour, menu item, and operating period to the cash the unit actually creates, helping hospitality operators understand whether additional volume is genuinely improving profitability.
Start With Contribution Margin, Not Revenue
Revenue tells you how much money came through the door. Contribution margin tells you how much remains after the direct costs required to generate that revenue.
At a simple menu-item level:
Contribution Margin = Selling Price – Variable Cost
Suppose a restaurant sells a steak entrée for $38 and the direct ingredient cost is $13. The basic contribution margin is $25 before considering labor, occupancy, utilities, and other expenses.
Toast’s menu-engineering guidance emphasizes that contribution margin can be more useful than food-cost percentage alone because it reveals the actual dollars generated by individual items.
For a high-volume venue, operators should extend this idea to the guest level. Contribution margin per cover, per table, per event, and even per daypart can reveal whether apparently strong sales are actually valuable.
A $70 average check during dinner may look excellent, but a $48 lunch check with much faster turnover could generate more margin from the same physical space.
Treat Prime Cost as the Operating Engine
Prime cost combines cost of goods sold and total labor expense:
Prime Cost = COGS + Labor Cost
Restaurant365 notes that many full-service restaurants aim to keep prime cost below roughly 65% of sales, although appropriate targets depend heavily on concept and service model.
For advanced operators, however, the percentage itself is only the starting point.
Imagine two venues both running a 62% prime cost. One has stable food costs and unusually high labor. The other has efficient labor but major product waste. Their headline number is identical, but their operatonal problems are completely different.
High-volume hospitality teams should therefore break prime cost into drivers such as food, beverage, hourly labor, management labor, overtime, benefits, and payroll-related costs.
This makes corrective action much more precise.
Separate High Volume From Profitable Volume
More customers can create economies of scale, but higher sales do not automatically mean better economics.
National Restaurant Association data covering 2024 showed that full-service restaurants generating at least $2 million in annual sales reported a median food and non-alcohol beverage cost of 31.0% of sales. Restaurants below $2 million reported a median of 33.7%.
That difference illustrates how volume can improve purchasing leverage, product utilization, and fixed-cost absorption.
However, extra demand becomes less attractive when it requires excessive overtime, inefficient discounting, expensive third-party channels, or additional management layers.
The useful question is therefore not simply, “How many more covers can we serve?”
It is, “What happens to incremental contribution margin when we serve the next 100 covers?”
That small change in thinking is central to Advanced Restaurant Unit Economics.
Measure Labor Productivity by Daypart
Labor percentage is useful, but high-volume operators should also track sales per labor hour, or SPLH.
If a venue produces $18,000 of revenue during a shift while using 300 labor hours, SPLH equals $60.
The metric becomes particularly powerful when compared across breakfast, lunch, dinner, weekends, events, and seasonal periods. 7shifts describes SPLH as a way to understand the revenue generated for each paid labor hour.
Consider a Friday dinner producing $65 SPLH versus a Tuesday dinner at $39. That difference may justify completely different staffing structures.
The goal is not always reducing headcount. Understaffing a packed venue can slow ticket times, reduce table turns, weaken beverage sales, and hurt repeat visits.
Better labor economics means placing the right number of people at the right stations for the expected demand curve.
Accurate forcasting matters more than simply cutting shifts.
Track Theoretical Versus Actual Food Cost
Traditional food-cost reporting tells management what inventory actually cost. Advanced analysis asks another question: what should it have cost based on the items sold?
This creates the theoretical-versus-actual comparison.
If recipe data suggests food usage should have been $42,000 but actual inventory movement shows $45,500, the $3,500 variance deserves investigation.
Possible causes include overportioning, spoilage, incorrect recipes, unrecorded staff meals, purchasing errors, theft, or inventory-count problems.
Lightspeed specifically highlights the value of comparing theoretical inventory with actual stock to identify waste and discrepancies.
In a small restaurant, a one-point variance may seem manageable. At a venue doing several million dollars annually, that same percentage can become a major proftability issue.
Build a Sensitivity Model Before Making Decisions
Advanced unit economics should help management answer “what if?” questions before money is spent.
For example, what happens if:
- average check rises 3%;
- ingredient costs rise 5%;
- hourly wages increase 7%;
- table turns improve from 1.8 to 2.1;
- weekend covers increase 10%;
- operating hours are extended by one hour?
A simple sensitivity model can reveal which variables have the biggest influence on unit-level EBITDA or operating profit.
Suppose a $6 million venue runs at an 8% operating margin. That produces $480,000 in operating profit.
If uncontrolled food and labor expenses jointly rise by only two percentage points of sales, approximately $120,000 of that profit could disappear, assuming everything else remains constant.
That is why managers should model percentage changes in dollars rather than treating them as abstract accounting ratios.
Advanced Restaurant Unit Economics turns restaurant finance into a practical operating system.
Contribution margin, prime cost, labor productivity, inventory variance, and scenario modeling show where high-volume sales truly become profit.
Instead of chasing revenue alone, build a unit-level dashboard that connects daily decisions with financial outcomes. Start with one venue, measure consistently, and refine the model as your operation grows.